Page: 1 2 3 4 5 6 7 8 9 10 11 12 13 14 15 16 17 18
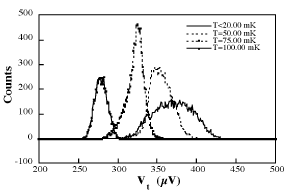
Generally the threshold voltage decreases with increasing temperature as shown in figure 12. Sometimes, especially when the histograms have double peaks, Vt is lower at base temperature (<20 mK) than at 50 mK. At 75 and 100 mK Vt always decreases substantially. See also figure 8.
The frequency dependence is rather complicated. At low Vs the threshold voltage
decreases with increasing frequency, but at high Vs it increases with higher
frequency. At still higher Vs it seems that Vt is independent of frequency. This
is consistent with the picture with excess charges in the array. There is a
competition between the relaxation time of the charges and the time spent in the
zero-current state. At low Vs there are charges left from the negative current,
giving lower Vt, but at low enough frequency those charges will have time to
relax by diffusing out of the array or annihilating each other before the
voltage reaches the threshold voltage. At higher Vs the charges left are from
the positive current, which will increase Vt unless the charges have time to
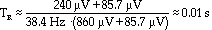
relax. Figure 13 shows several histograms with different frequencies and Vs. In
the third graph (Vs=-85.7 ÁV) the histogram for 38.4 Hz is approximately halfway
relaxed. We can estimate the relaxation time  the time it takes for the voltage
to rise from Vs=-85.7 ÁV to Vt240 ÁV, knowing
that the ramp stops at 860 ÁV:
the time it takes for the voltage
to rise from Vs=-85.7 ÁV to Vt240 ÁV, knowing
that the ramp stops at 860 ÁV:
13
<===Previous page ooo Next page ===>
My homepage.