Monitoring
System monitoring is provided by the lwrocmon program. It connects to the requested node and displays updated information.
For tree views, it also follows any drasi data connections, to display information for all connected systems.
Rates
To monitor the readout or event-building rate of a single node, run:
bin/lwrocmon --rate <node>
The monitoring data is updated once per second. Rates are in Hz or bytes per second.
Monitoring rates for an event builder (EB). Magenta labeled items relate to the event building, the blue to online data clients and brown to file writing.
Tree view
To display a tree view of an entire setup, run:
bin/lwrocmon --rate <node>
<node> can be any node in the setup.
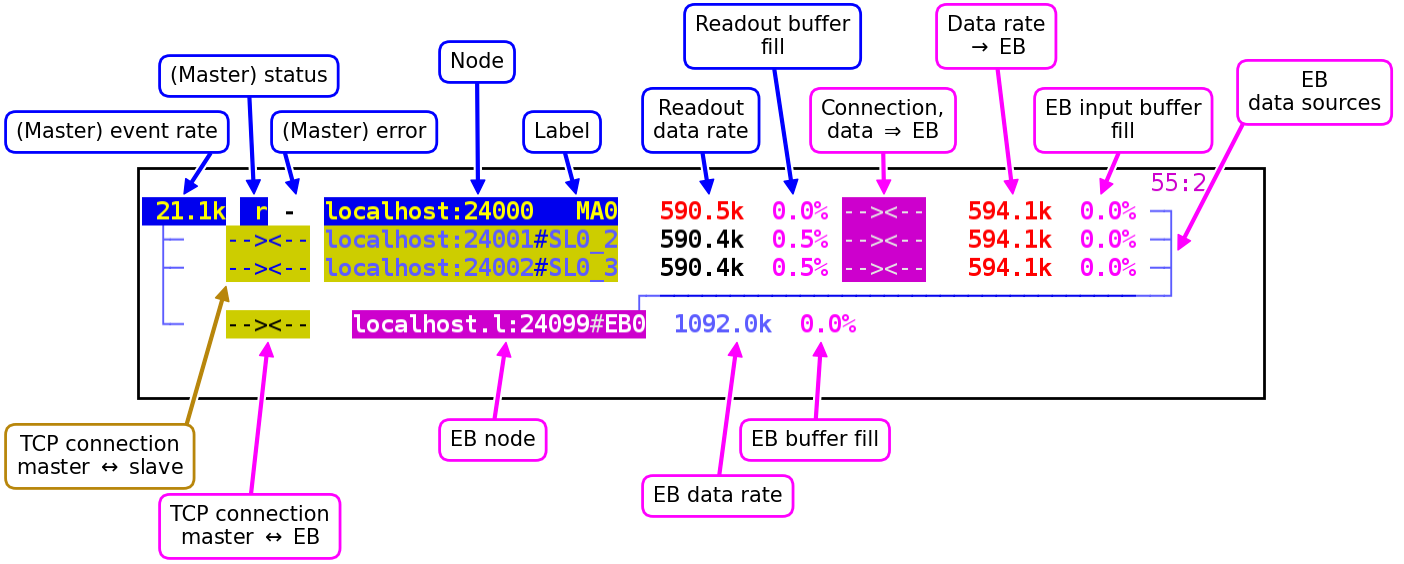
Monitoring tree for a master with two slaves and an event builder (EB). Blue labeled items relate to the master, yellow to the slaves, and magenta to the event builder.
The monitoring data is updated two times per second. Rates are in Hz or bytes per second.
The right-most data rate and fill levels are within the event builder (or time sorter). It is printed on the lines of the readout nodes they correspond to, since one entry is needed for each node.
Since internal connections must be accepted by both sides, the two arrows directed towards each other indicate the status at the two ends.
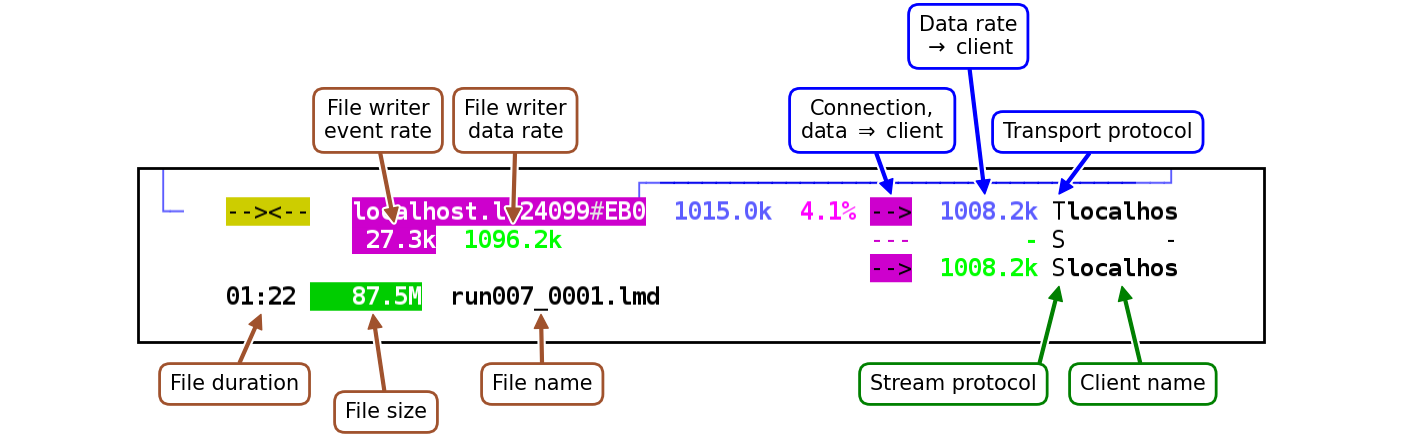
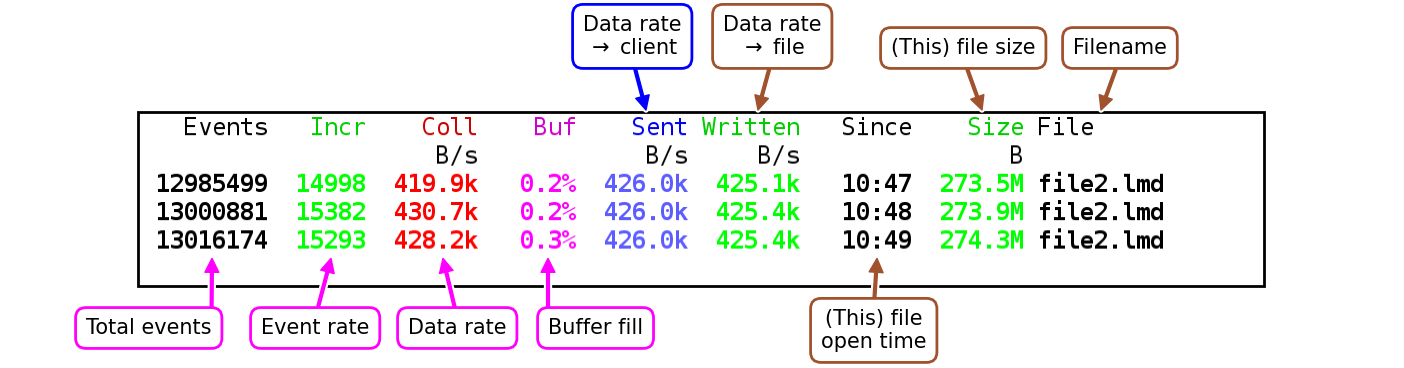
Monitoring information for file writing and online data clients. Brown labeled items relate to file writing, and blue and green to the transport and stream online data clients, respectively.
Status codes
The status codes in the rate and tree monitor describe the overall acquisition status of readout nodes.
Lower-case one-letter codes are in principle fine, as acquisition progress is being made. Two-letter codes means trouble. Two-letter codes that start with ‘W’ (or “Wt”) means that the acquisition state machine is being held for some reason.
| Status | Code | Description |
|---|---|---|
| (rate) | (tree) | |
| ReInit | R | Re-initialise. |
| WtAbort | WA | Wait for master/slaves to abort test/readout, or EB to abort failed validation. |
| WtTerm | WT | Wait for acqusition termination to complete. |
| WtConn | WC | Wait for slave connection. |
| WtEBClr | WE | Wait to clear EBs. |
| WtMaster | WM | Wait for master initialisation. |
| WtSlave | WS | Wait for slave initialisation. |
| WtIdent | WI | Wait for validated connections from readout to EB. |
| WtTest | Wt | Wait for test. |
| WtRun | Wr | Wait for readout to enter run mode. |
| Test | T | Test trigger bus. |
| run | r | Running. |
| inspill | i | Running, in-spill. |
| st.inspl | k | Running, stuck in-spill (no end-of-spill trigger for a long time.) |
| offspill | o | Running, off-spill. |
| stopped | S | Stopped. |
| WaitNet | WN | Waiting for network (to get EB or slave status). |
| DeadTime | DT | Waiting for deadtime release. |
| BufSpace | BF | Waiting for buffer free space. |
| Readout | RD | In readout. |
| NoDiagns | D? | No diagnosis - reason for non-progress could not be determined. |
| slave | s | Slave system. |
| WtOSlave | Ws | Slave, wait for readout control to respond. |
| Headache | HA | User routine has reported headache. E.g. due to lengthy reset operations. |
Error codes
Some failures are indicated by error codes.
| Error | Code | Description |
|---|---|---|
| (rate) | (tree) | |
| Local | L | Local (master) issue. |
| Net | N | Network issue. |
| EB_ID | I | Event builder got bad ident message. |
| Test | T | Trigger bus test failaure. |
| Mism | M | Trigger bus mismatch. |
| ECdsync | C | Slave has desynchronized event count. |
| UnExpTrg | U | Unexpected trigger. |
| DataCon | D | Event builder data connection failure. |
| BugFatal | B | Bug or fatal error reported. (DAQ process held for debugging.) |
Issues with the trigger bus status are indicated for slave systems.
| Error | Code | Description |
|---|---|---|
| (rate) | (tree) | |
| Waiting | W | Waiting for slave. |
| Deadtime | D | Slave is in deadtime. |
| Fail | F | (Unknown) failure. |
Issues with merger (event builder and time sorter) sources are indicated at the respective input buffer (right-most side).
| Problem | Code | Description |
|---|---|---|
| Full | F | Input buffer is full. |
| Disabled | X | Source is disabled (no data available). |
| Broken | B | Source delivers broken timestamps. Its events are sorted as 0, when available. |
Keyboard shortcuts
A few keyboard shortcuts cycle through presentation of different monitoring aspects:
| Shortcut | Aspect | Show |
|---|---|---|
| b | Data buffers | Print fill ratio. |
| . | Print size. | |
| t | Timestamp tracking | In readout. |
| . | At time-sorter input. | |
| . | Both. | |
| . | None. | |
| r | Timestamp values | Show hex values. |
| . | Show decimal value. | |
| . | Show date-time formatted text. | |
| . | None. | |
| s | Timesorter timestamp analysis | Sync check. |
| . | Match events. | |
| . | None. |
Timestamp alignment
The time sorter can evaluate the alignment of timestamps.
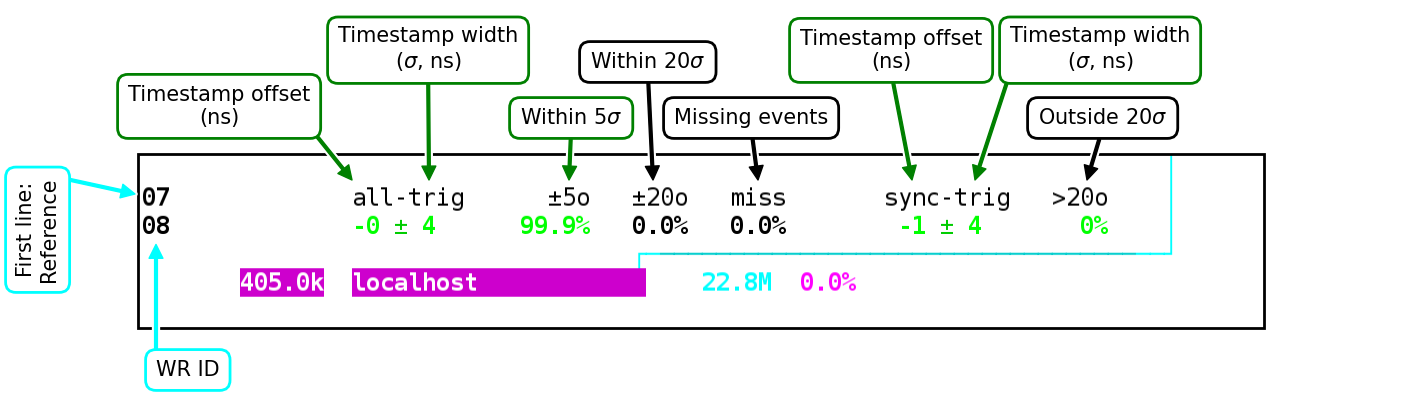
The first line with labels refers to the reference system. The first set of values applies to all triggers, matched with the closest trigger in the reference system. The second set of values applies only to sync triggers (which are easier to match).
Sync check values
The time sorter can perform sync check value monitoring.
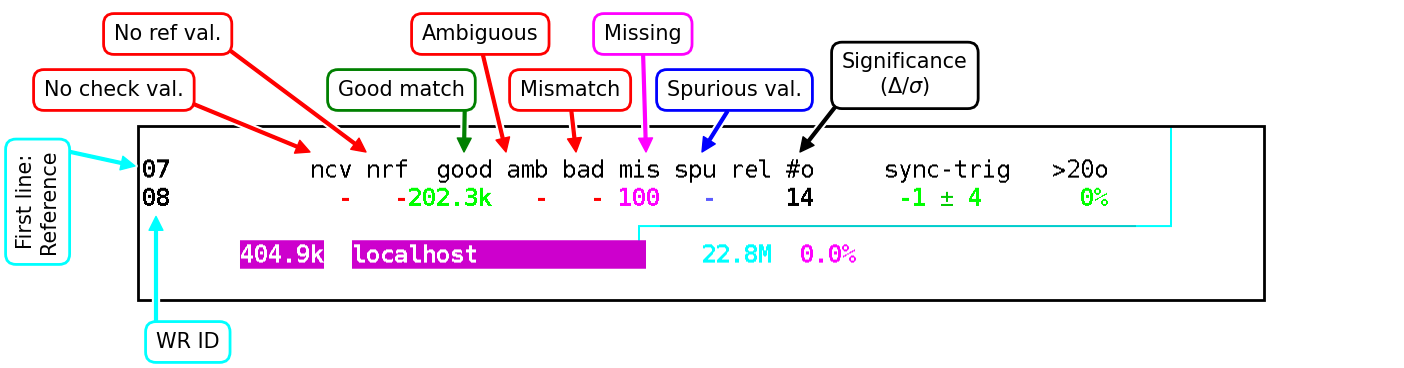
The first line with labels refers to the reference system. Events can lack sync check values, or by timestamp be associated with reference events that lack values. The matching can be good, or ambiguous, or mismatching. When no local event corresponds to a reference event, it is missing. A local value with no corresponding reference event is spurious. The significance gives the separation of sync check values divided by their widths.